The latest energy indicators provide a cross-sector view of how India is managing the twin priorities of growth and transition. From petroleum supply chains and gas availability to electricity generation and distribution reforms, the data traces the operating realities behind the country’s energy demand, investment momentum and infrastructure modernisation at the turn of 2025–26.
Oil & Gas:
India’s indigenous crude oil and condensate production registered 2.27 MMT in December 2025, comprising its domestic petroleum supply component. During the month, refineries processed 23.77 MMT of crude oil. This signalled a steady utilisation of the country’s extensive refining capacity. In December 2025, India’s total oil imports that consists crude and petroleum products stood at 25.58 MMT, reflecting the scale of raw material required to meet domestic consumption and refinery feedstock needs. The country exported 5.41 MMT of refined petroleum products, which highlights its continued presence in international fuel markets.
Supporting demand from power, fertiliser, city gas and industrial segments, domestic natural gas production reached 2,896 Million Standard Cubic Meters (MMSCM). Also, Liquified Natural Gas (LNG) imports amounted to 2,808 MMSCM.
This shows imported gas comprises a significant and complementary component of overall gas availability. Providing a relatively stable pricing environment for the sector, the Indian basket crude price averaged $65.95 per barrel in February 2025.
Overall, these indicators show an energy sector with robust refining activity, active trade in petroleum products and a balanced combination of domestic and imported gas supplies operating under moderate global crude prices.
Power & Utilities:
Reflecting steady growth in power availability across all sources, the country’s electricity system delivered 149.74 BU of total generation in December 2025.
While thermal plants remained the backbone with 113.39 BU, nuclear contributed 4.22 BU and large hydro added 8.77 BU, indicating a diversified conventional generation mix.
Renewable energy, including small hydro, produced 23.33 BU, underlining the expanding role of clean power in the grid. Electricity import from Bhutan was modest at 0.03 BU, showing continued cross-border cooperation in regional power trade.
The grid was able to manage demand effectively, with peak demand of 2,41,213 MW almost fully met at 2,41,201 MW, demonstrating strong system reliability and adequacy of supply during the month.
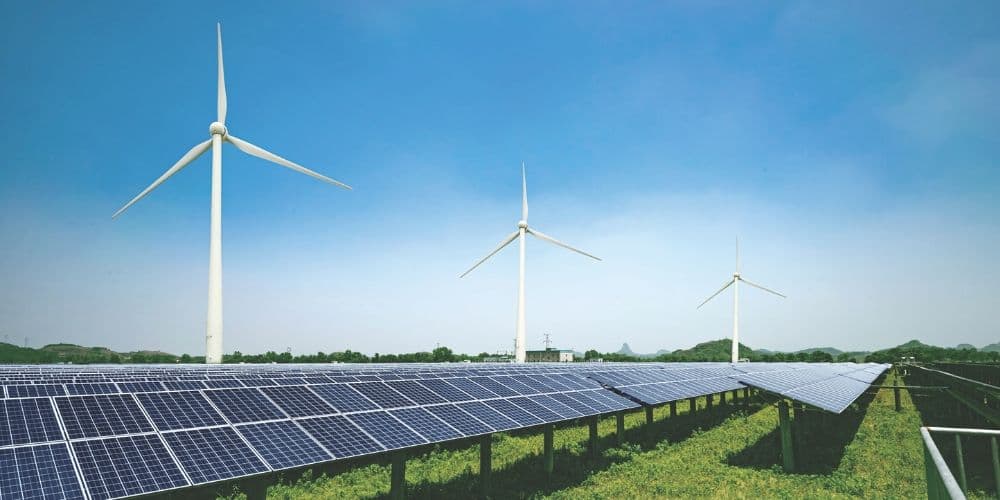
On the capacity addition front, the renewable transition gathered pace with 2,961.70 MW of new solar capacity and 524.91 MW of wind capacity added in December 2025, highlighting sustained investment momentum in green energy. Progress in the digitalisation of distribution is reflected in smart metering.
Under the Revamped Distribution Sector Scheme (RDSS), 22.42 crore meters have been sanctioned and 15.02 crore awarded. During January 2026, 33.38 lakh meters were installed, pointing to continued rollout of consumer-level reforms. Overall, the indicators depict a power sector that is meeting demand reliably, expanding renewable capacity, and modernising distribution infrastructure.
This is by maintaining a balanced generation mix led by thermal power and supported increasingly by renewables.
Collectively, the dashboard indicators show an energy sector that is sustaining momentum across fuels and power, and adapting to changing demand patterns. While gas availability is being supported through a combination of domestic output and LNG, strong refinery performance and active product trade continue to shape the petroleum landscape. In electricity, dependable generation, growing renewable additions and progress in smart metering signal steady modernisation of the grid. These trends reflect India’s ongoing effort to maintain reliability, expand cleaner capacity and strengthen the foundations of its energy infrastructure.